Fitting-Methods
Extracting Positions from Masks
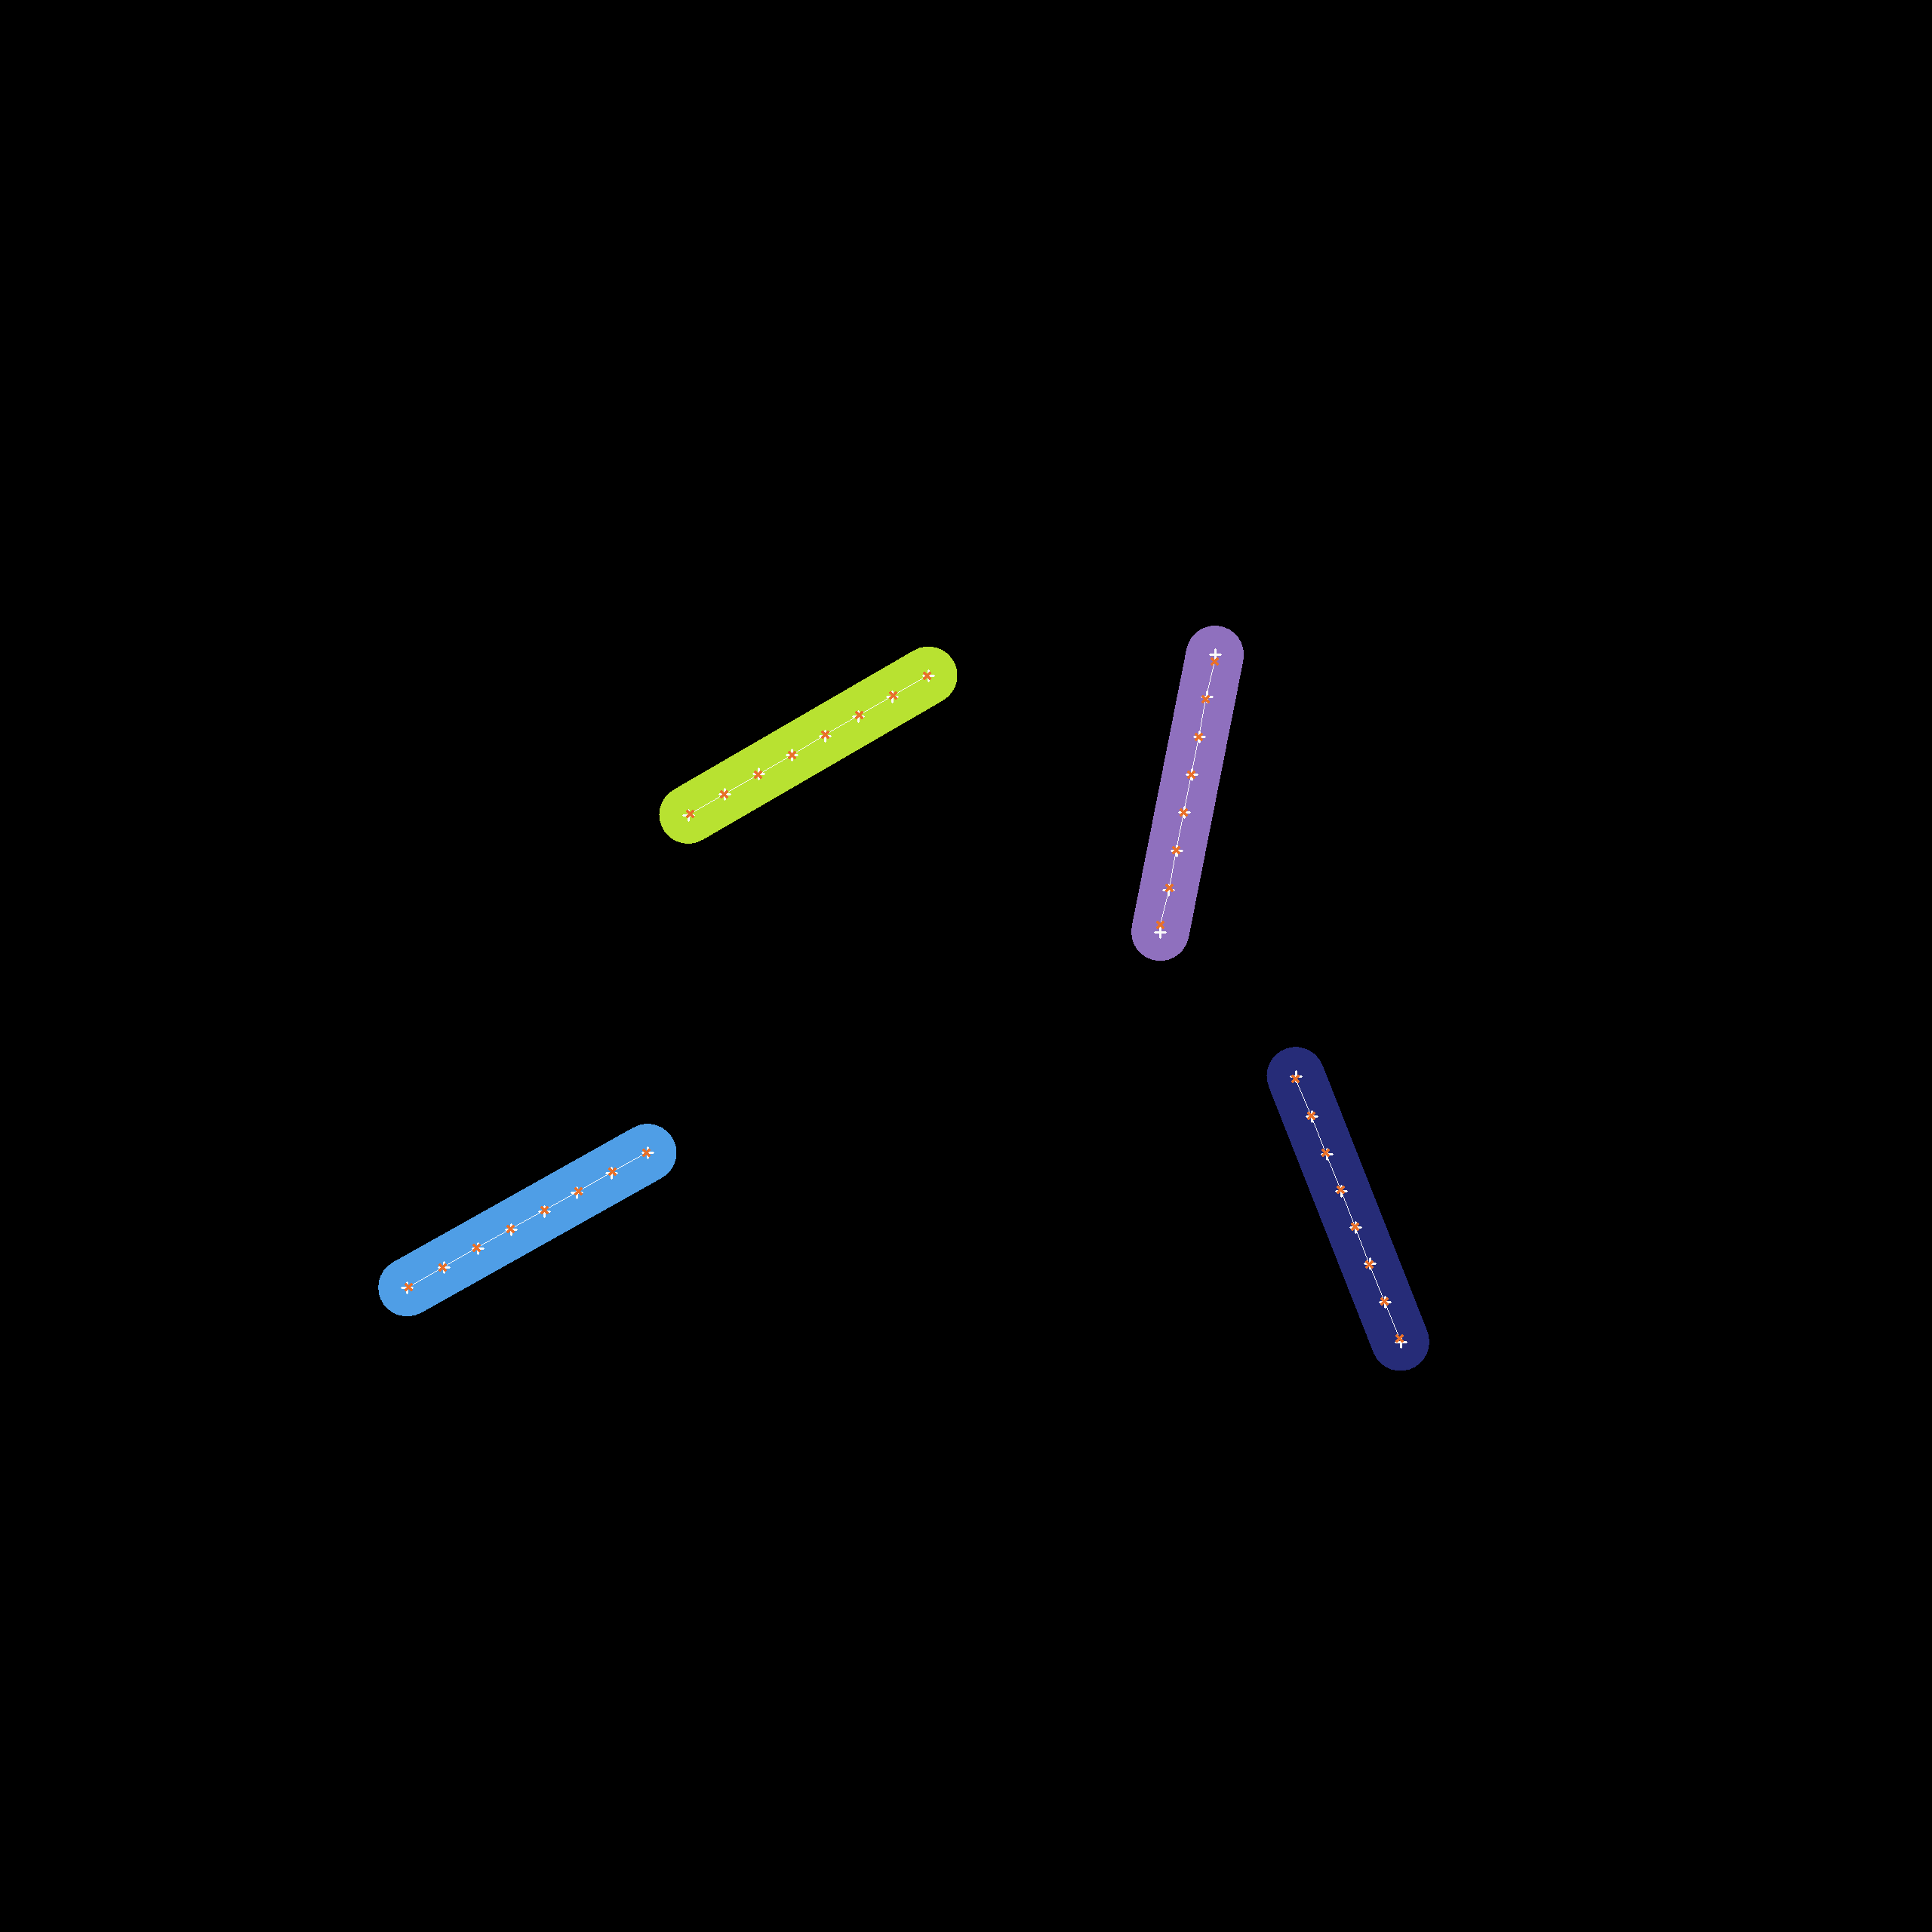
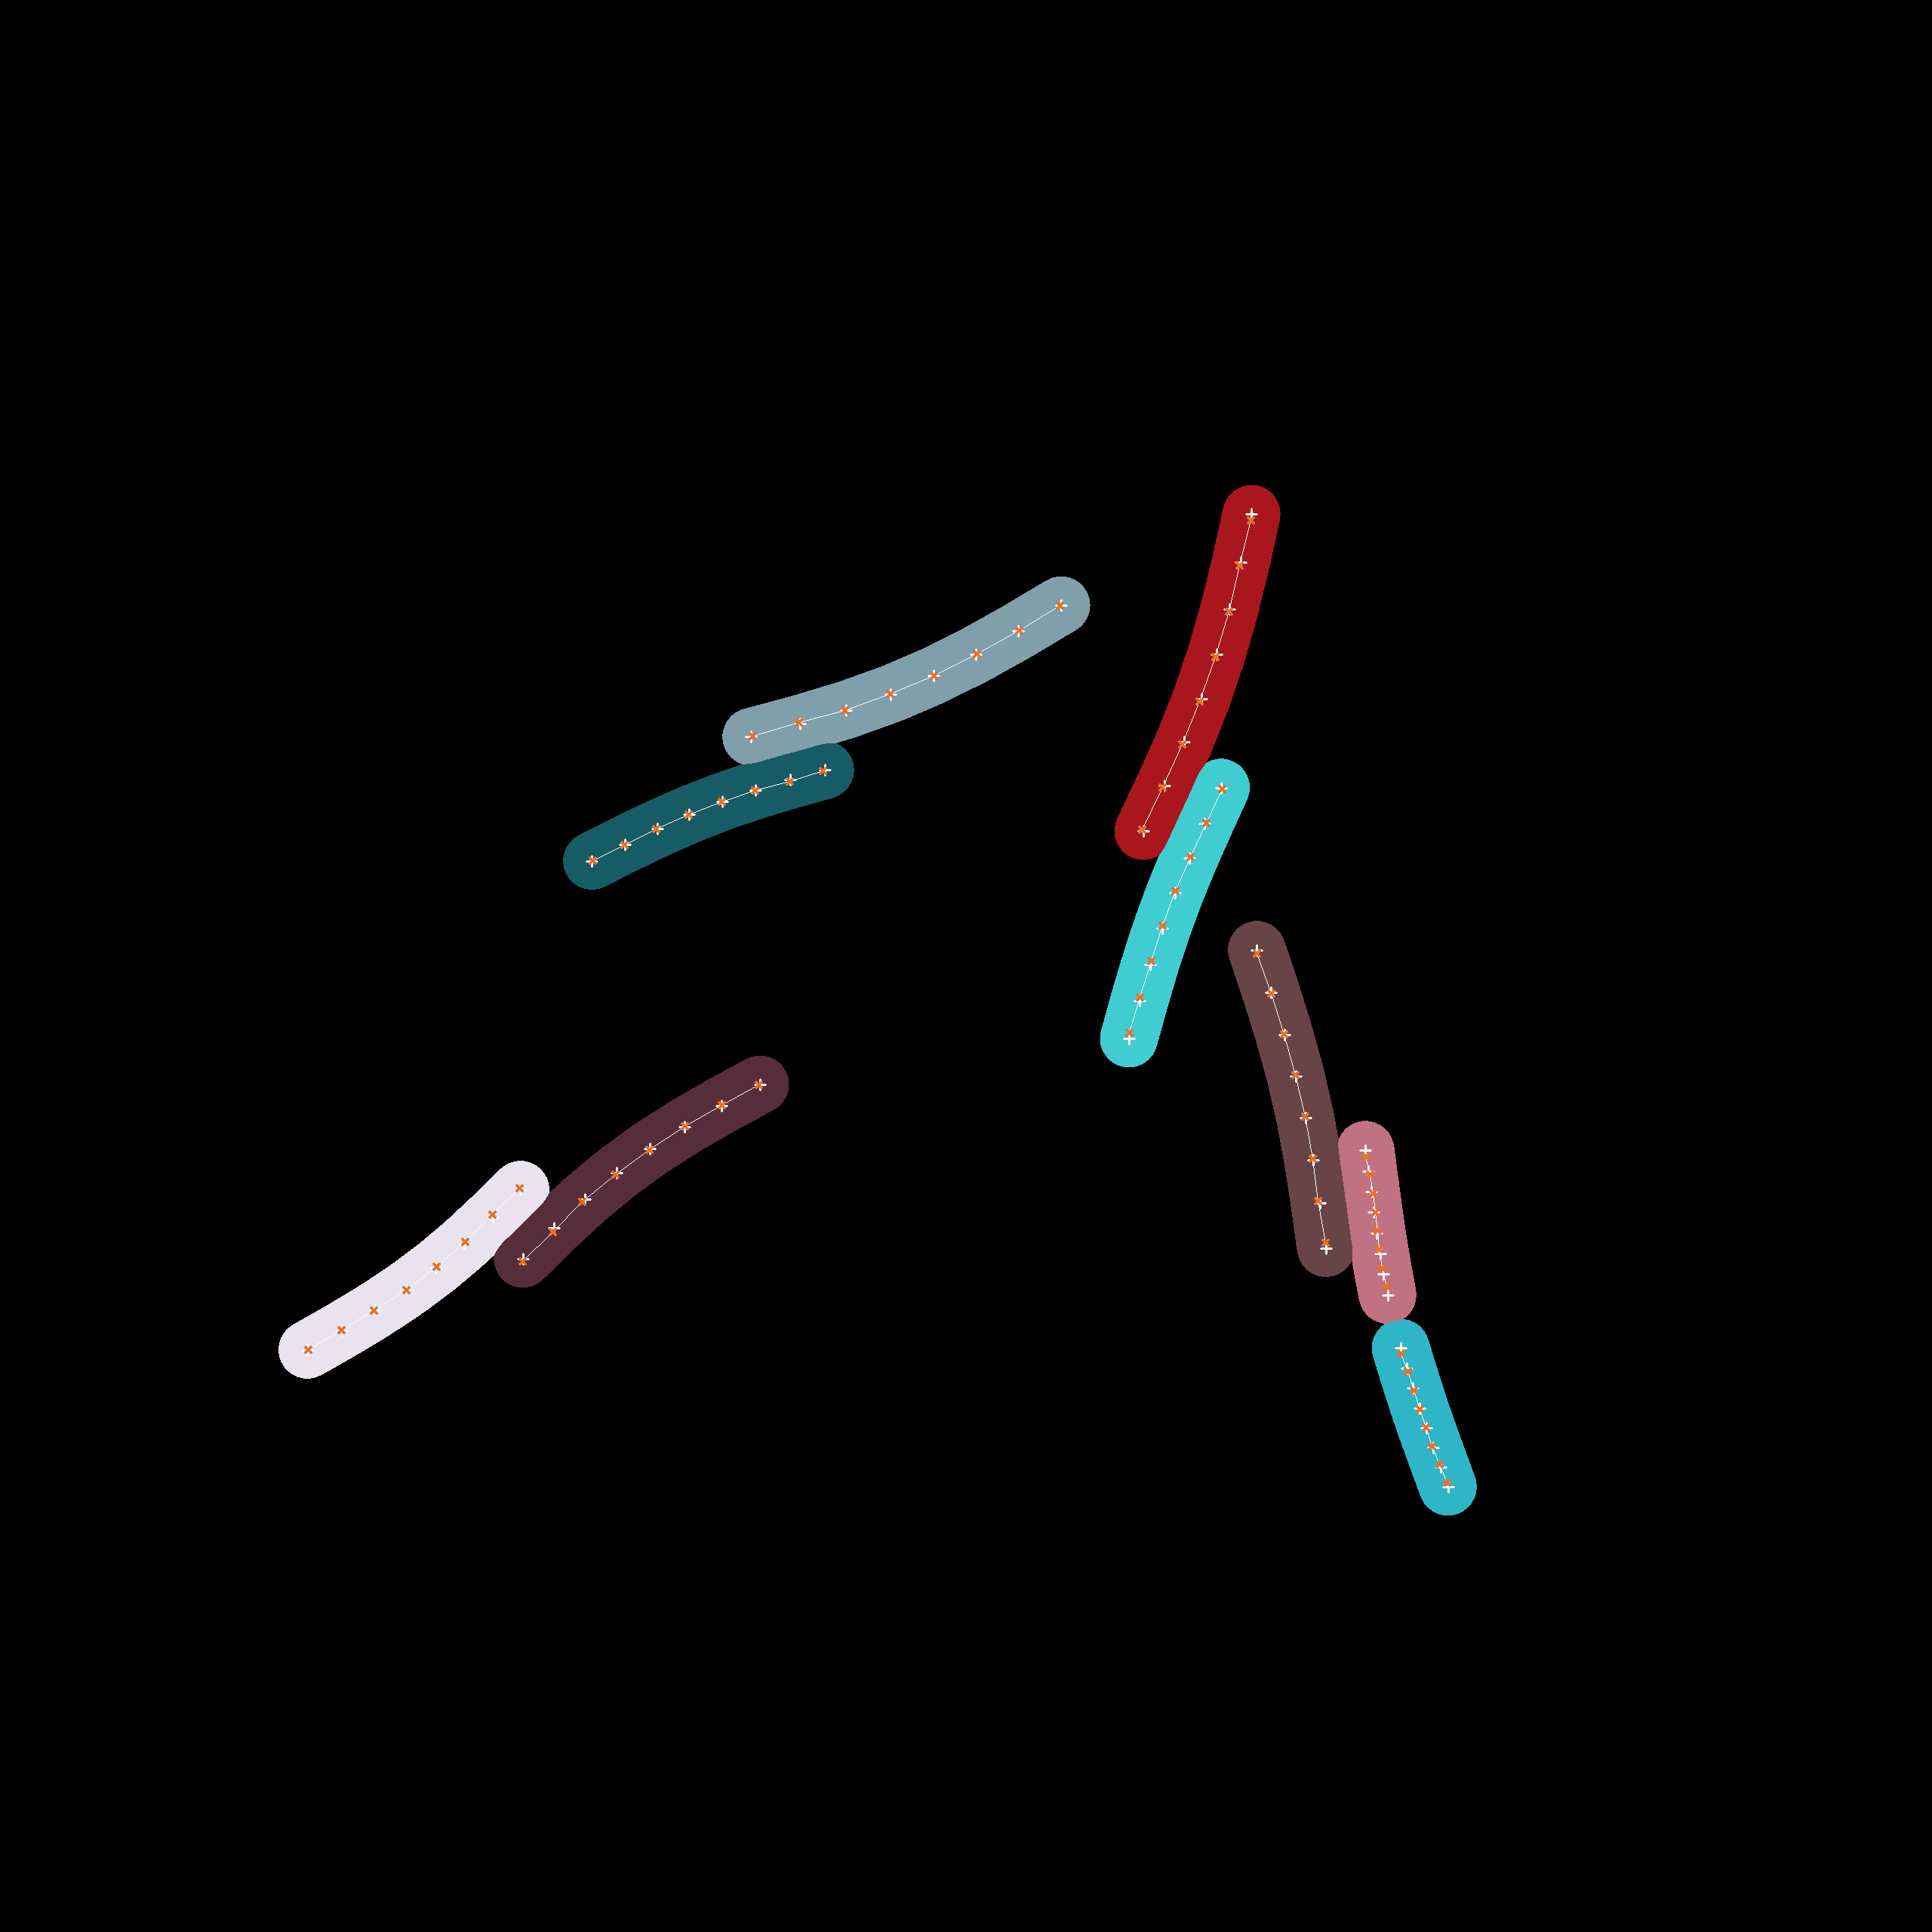
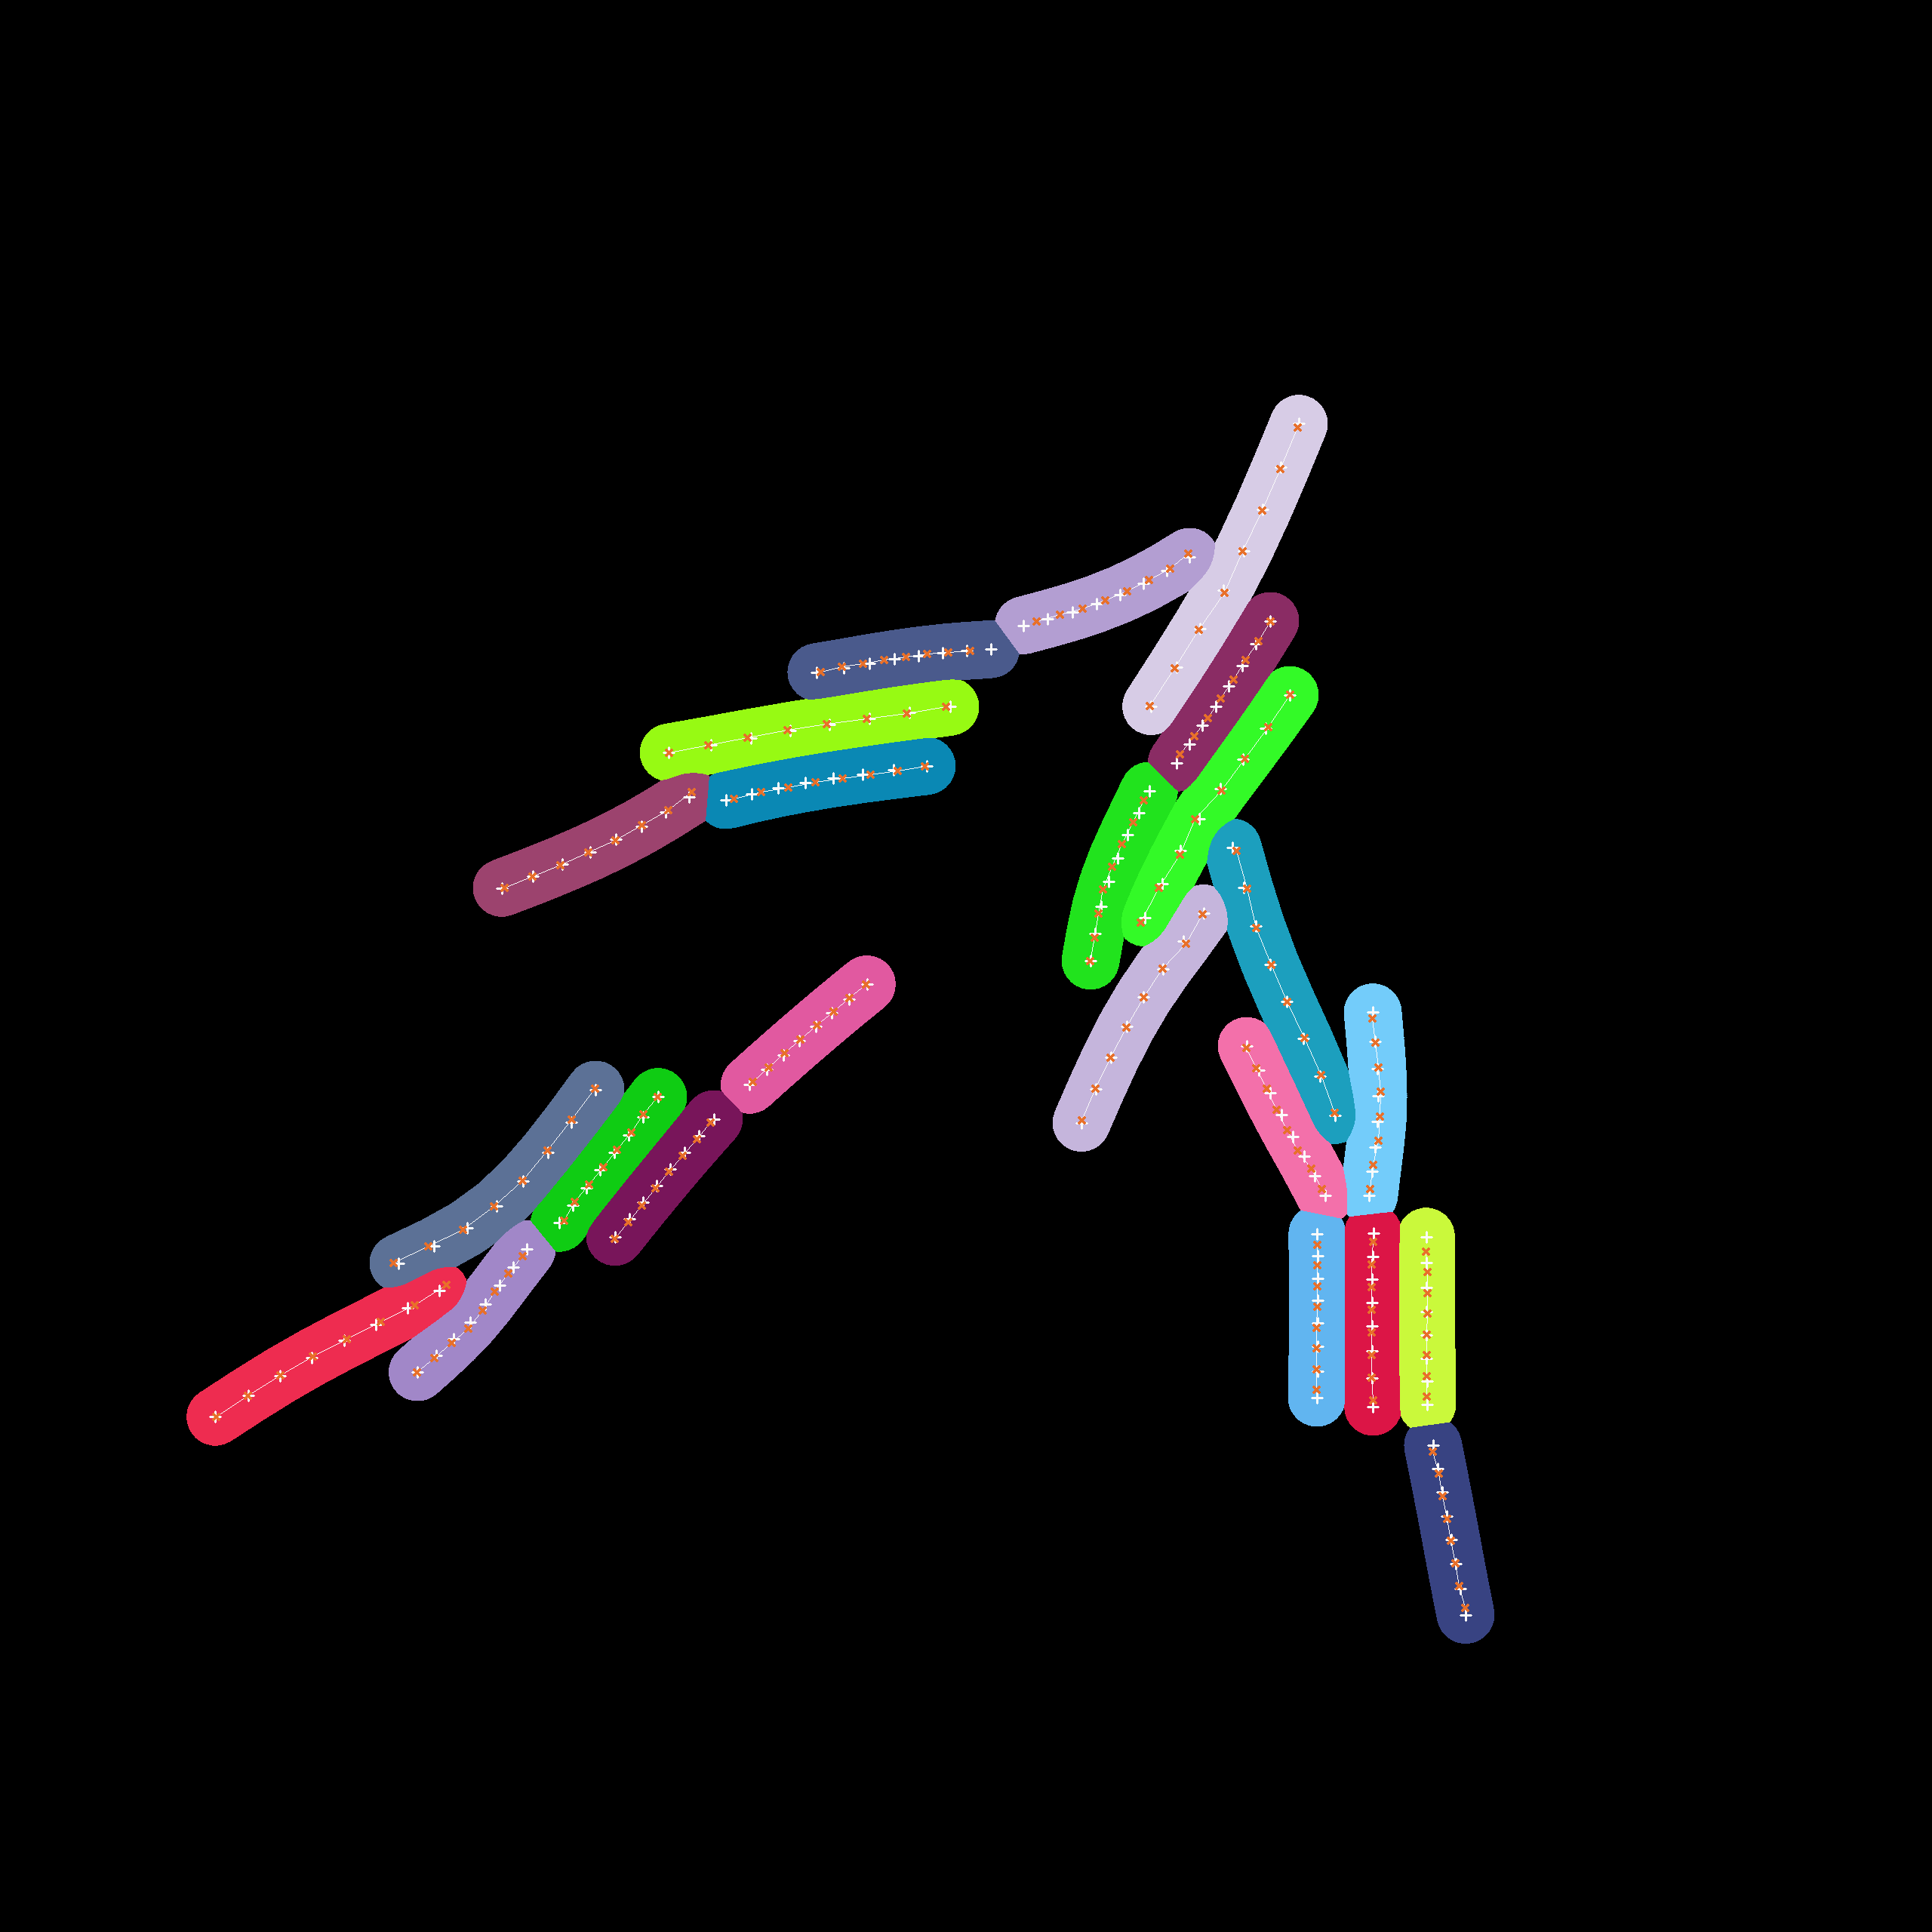
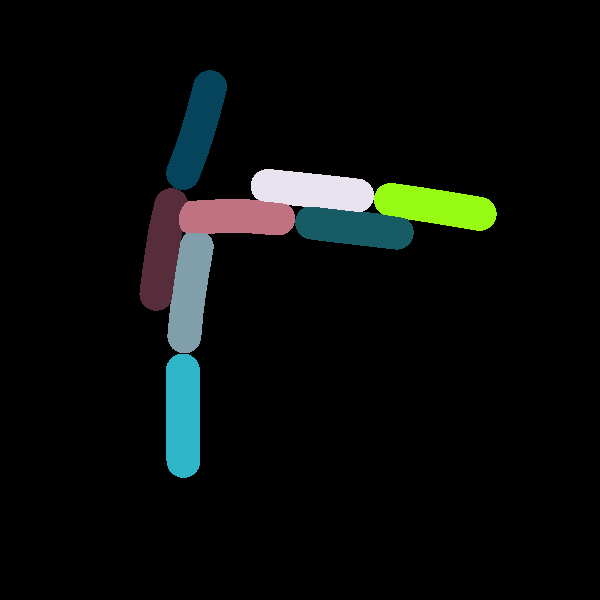
Instance-level cell masks of a simulation run starting with 4 agents. The positions associated to the individual cell agents which have been estimated by our fitting process are displayed with dark crosses while the segments which actually constitute the cell are displayed as a contiguous bright line.
We provide an extraction algorithm which utilizes instance-level cell masks and extracts the positions of the cells in the form of individual vertices. It works in multiple states:
Calculate individual mask segments for cells
Skeletonize cell-mask [9]
Sort points along major axis
Calculate evenly-spaced segments along points, thus obtaining vertices (see Model).
In particular, this algorithms fails if for any reason, multiple start or end points were identified.
To quantify the effectiveness of this extraction algorithm, we compare the average rod lengths of the known simulated agent and teh eestiamted positions with each other. Furthermore, we calculated the average difference per vertex between the simulated position and the estimated one. The next figure shows this evaluation for the above presented time series.
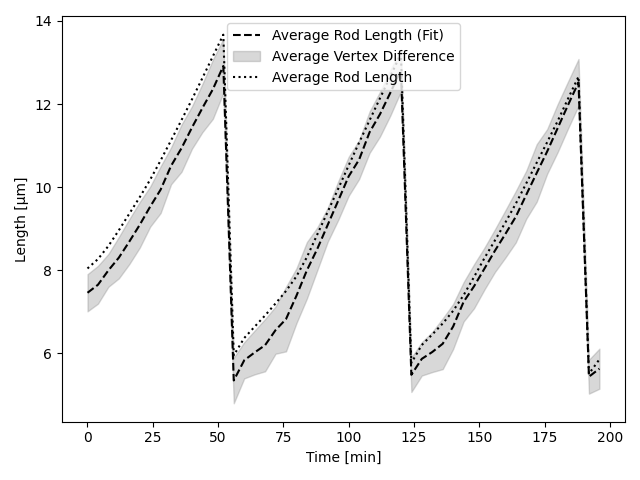
We can clearly see that the fitting method slightly underestimates the total rod length. This can be attributed to the Skelezonization algorithm [9] which truncates the ends of the point set more. As time increases, our fitting method becomes less accurate. However, overall slopes and division events are still captured correctly. This behaviour is due non-trivial geometries of the cell which makes it harder to properly estimate the approximating polygon.
Constucting a Cost Function
The previously explained extraction algorithm allows us to obtain positional information in the form of the cells vertices. These vertices can also be used for parameter estimation purposes, by simply applying any chosen distance metric. However, in the case when the bacteria divide, the direct comparison of extracted and simulated vertices fails, since particular time points of the simulation or real data contain more/less cells than the other. This would require us to compare arrays of varying dimension. However, we can circumvent this situation by following a different approach. By synthetically generating instance-level cell masks, we can compare said masks to the experimental ones. We can now compare the synthetic and experimental image, assigning a penalty \(p\) whenever two pixels are not matching. However we need to take into account if the cells associated with the respective color are related to each other, by either one being daughter or mother of the other. By assigning a reduced penalty \(p_p<p\) in this case, we account for the fact that the cell in question will divide, thus eventually producing a matching value, although the current timing may not yet be appropriate (depending on the optimized scenario). The differences which are calculated by this method are presented in the next figures.

Two states of a system which are being compared to each other. The second snapshot contains 5 more cells due to additional division events.
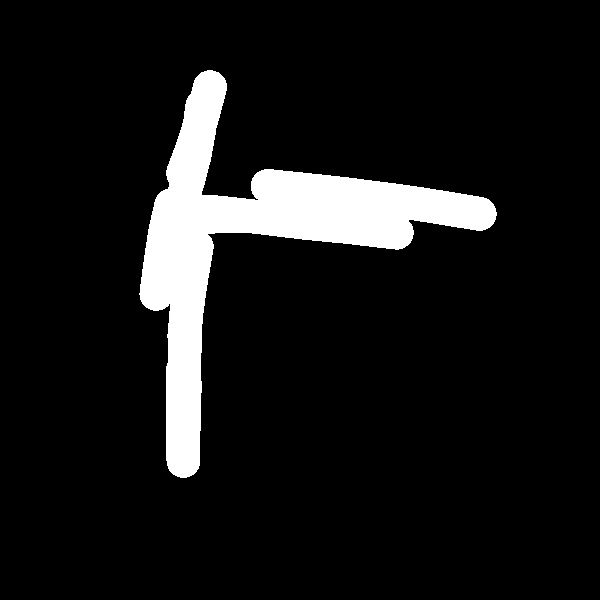
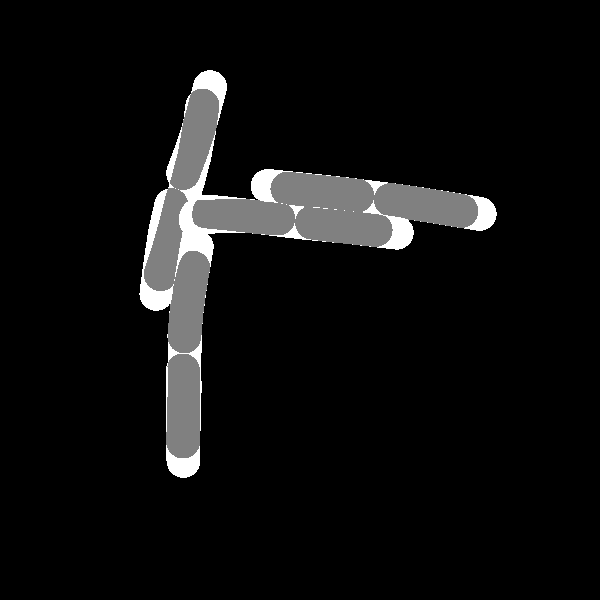
Calculations of differences between the images. The first image purely calculates the differing area while the second approach also takes into account if cells are related and weighs this specific overlapping area with a reduced penalty value \(p_p\).